
Week 3Sat, Sep 19ACC NetworkCalifornia Memorial Stadium
| Q1 | Q2 | Q3 | Q4 | T | |
|---|---|---|---|---|---|
| WAG | 0 | 7 | 0 | 0 | 7 |
 CAL | 29 | 10 | 7 | 3 | 49 |
Play-by-play
FinalLine of scrimmageFirst down
Last play·
00:00
Game update
End Game
See playsHide plays
Leaders
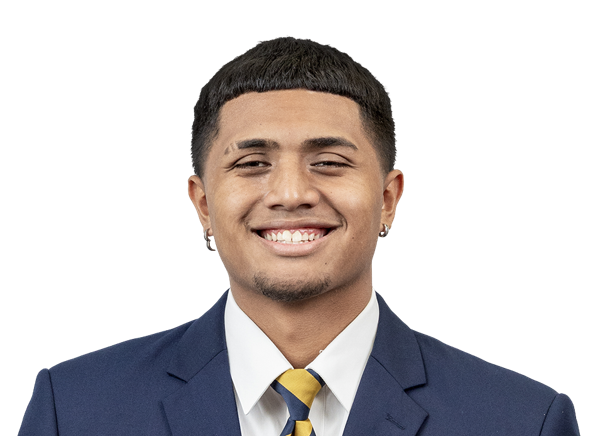
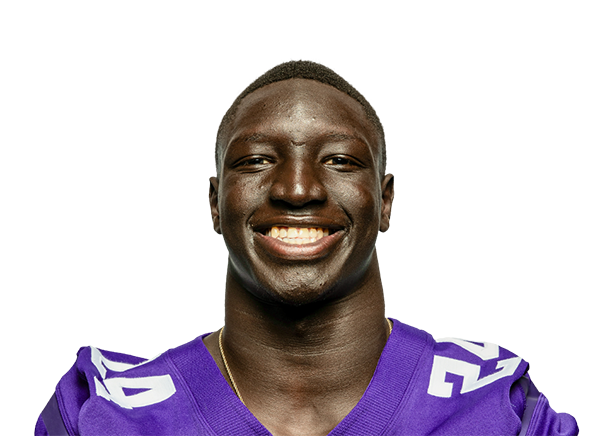
Passing
15/31, 1 TD, 1 INT
86 YDS
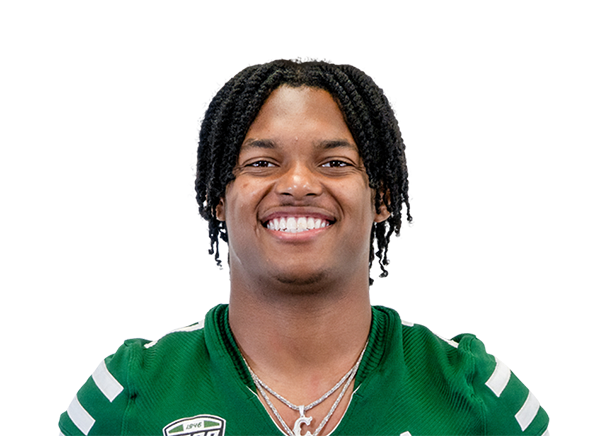
Receiving
3 REC on 6 TGT, 0 TD
24 YDS

Team stats
WAG CAL
198 Total yards 626
3.4 Yards per play 8.8
86 Passing yards 492
112 Rushing yards 134
10 First downs 27
59 Plays 71
4-15 3rd down 3-9
1-1 4th down 2-3
1-2 Red zone 5-6
1 Turnovers 2
4 Penalties 8
28:11 Possession 31:49
Box score
| Passing | C/ATT | YDS | AVG | TD | INT | SACK | RTG |
|---|---|---|---|---|---|---|---|
| Benjamin Newman QB · #10 | 15/31 | 86 | 2.8 | 1 | 1 | 0 | 75.9 |
| Jason Wiley QB | 0/1 | 0 | 0.0 | 0 | 0 | 0 | 0.0 |
| Team | 15/32 | 86 | 2.7 | 1 | 1 | 0 |
| Rushing | CAR | YDS | AVG | TD | LONG |
|---|---|---|---|---|---|
| Shawn James RB · #33 | 8 | 36 | 4.5 | 0 | 24 |
| Benjamin Newman QB · #10 | 1 | 23 | 23.0 | 0 | 23 |
| Matt Morad RB · #03 | 8 | 19 | 2.4 | 0 | 9 |
| Cristian Pinto QB · #14 | 2 | 14 | 7.0 | 0 | 9 |
| Andrew Ransome RB · #34 | 3 | 11 | 3.7 | 0 | 4 |
| Uriah Moats-Maynard RB · #28 | 5 | 9 | 1.8 | 0 | 4 |
| Team | 27 | 112 | 4.1 | 0 | 24 |
| Receiving | REC | TGT | YDS | AVG | TD | LONG |
|---|---|---|---|---|---|---|
| Derek Burrell WR · #19 | 3 | 6 | 24 | 8.0 | 0 | 12 |
| Jeremiah Colclough WR · #04 | 3 | 4 | 24 | 8.0 | 0 | 10 |
| Malik Redd WR · #02 | 3 | 5 | 20 | 6.7 | 1 | 11 |
| Zion Fowler-El WR · #01 | 2 | 4 | 8 | 4.0 | 0 | 8 |
| Uriah Moats-Maynard RB · #28 | 1 | 1 | 5 | 5.0 | 0 | 5 |
| Matt Morad RB · #03 | 2 | 5 | 3 | 1.5 | 0 | 3 |
| Teree McDonald WR · #09 | 1 | 4 | 2 | 2.0 | 0 | 2 |
| Karlos Grier WR · #13 | 0 | 1 | 0 | 0.0 | 0 | – |
| Richard Perkins Jr. WR · #08 | 0 | 1 | 0 | 0.0 | 0 | – |
| Johans Bars TE · #84 | 0 | 1 | 0 | 0.0 | 0 | – |
| Team | 15 | 32 | 86 | 5.7 | 1 | 12 |
| Defense | TOT | SOLO | SACK | TFL | QB HIT | PD | INT | FF |
|---|---|---|---|---|---|---|---|---|
| Shamar Williams DB · #01 | 10 | 4 | 0 | 0 | 0 | 0 | 0 | 1 |
| Brendan Leal LB · #04 | 6 | 1 | 0 | 0 | 0 | 0 | 0 | 0 |
| Evan Dukes DB · #11 | 6 | 2 | 0 | 0 | 0 | 0 | 0 | 0 |
| Julio Tatis DB · #24 | 5 | 5 | 0 | 0 | 0 | 0 | 0 | 0 |
| Vincent Bertone DB · #40 | 5 | 0 | 0 | 0 | 0 | 0 | 0 | 0 |
| Freddie Camp DB · #15 | 5 | 2 | 0 | 0 | 0 | 0 | 0 | 0 |
| Eli Hiscock LB · #12 | 4 | 0 | 0 | 0 | 0 | 0 | 0 | 0 |
| Jordan Gaston DL · #44 | 4 | 0 | 0 | 0 | 0 | 0 | 0 | 0 |
| Austin Bailey DB · #25 | 4 | 2 | 0 | 0 | 0 | 0 | 0 | 0 |
| Olanrewaju Adeyemi DL · #06 | 3 | 1 | 0 | 1 | 0 | 0 | 0 | 0 |
| Kahmari Valentine DL · #56 | 3 | 3 | 0 | 1 | 0 | 0 | 0 | 0 |
| Grant Edmond LB · #23 | 3 | 3 | 0 | 1 | 0 | 0 | 0 | 0 |
| Kasiem Cromwell DB · #27 | 3 | 0 | 0 | 0 | 0 | 0 | 0 | 0 |
| Acear Cornish LB · #03 | 3 | 1 | 0 | 0 | 0 | 0 | 0 | 0 |
| Cam Haynes LB · #26 | 3 | 0 | 0 | 0 | 0 | 0 | 0 | 0 |
| Ernest Blackshire Jr. DB · #17 | 3 | 0 | 0 | 0 | 0 | 0 | 0 | 0 |
| Nathan Moorehead DL · #90 | 3 | 0 | 0 | 0 | 0 | 0 | 0 | 0 |
| Logan Barnes DL · #00 | 2 | 2 | 0 | 1 | 0 | 0 | 0 | 0 |
| Abdoul Idriss LB · #09 | 2 | 2 | 0 | 0 | 0 | 0 | 0 | 0 |
| Auston Francis DL · #97 | 2 | 0 | 0 | 0 | 0 | 0 | 0 | 0 |
| Dashawn Long DB · #18 | 1 | 0 | 0 | 0 | 0 | 0 | 0 | 0 |
| Nick Parisi DL · #58 | 1 | 0 | 0 | 0 | 0 | 0 | 0 | 0 |
| Ryan Sissel LB · #07 | 1 | 1 | 0 | 0 | 0 | 0 | 0 | 0 |
| Yasin Elhossieni DB | 1 | 0 | 0 | 0 | 0 | 0 | 0 | 0 |
| Mateo Andrews DB · #48 | 0 | 0 | 0 | 0 | 0 | 0 | 0 | 0 |
| Team | 83 | 29 | 0 | 4 | 0 | 0 | 0 | 1 |
| Kicking | FG | PCT | XP | PTS |
|---|---|---|---|---|
| Johnny DiSalvatore K · #43 | 0/1 | 0% | 1/1 | 1 |
| Ryan Liszner K · #20 | 0/1 | 0% | 0/0 | 0 |
| Team | 0/2 | 1/1 | 1 |
| Punting | NO | YDS | AVG | IN 20 | LONG |
|---|---|---|---|---|---|
| Vincent Muscillo P · #98 | 8 | 288 | 36.0 | 1 | 41 |
Advanced team stats
Explosive 20+ rush · 25+ catch · 40+ home runWAG CAL
– Explosive plays 5
– Explosive rate 7.0%
– Explosive rushes 1
– Explosive passes 4
– Explosive yards 230
– Home runs 2
– Red zone trips 9
50% Red zone TD rate 67%
– Line yards per carry 3.35
– Stuff rate 11%
– Sacks allowed 0
5 Havoc plays 4
Advanced player stats
| WAG | Carries | Targets | Rec | Catch% | Touches | Share | Yards | TD |
|---|---|---|---|---|---|---|---|---|
| Matt Morad RB | 8 | 5 | 2 | 40% | 10 | 22 | – | |
| Shawn James RB | 8 | – | – | – | 8 | 36 | – | |
| Uriah Moats-Maynard RB | 5 | 1 | 1 | 100% | 6 | 14 | – | |
| Derek Burrell WR | – | 6 | 3 | 50% | 3 | 24 | – | |
| Jeremiah Colclough WR | – | 4 | 3 | 75% | 3 | 24 | – | |
| Malik Redd WR | – | 5 | 3 | 60% | 3 | 20 | 1 | |
| Andrew Ransome RB | 3 | – | – | – | 3 | 11 | – | |
| Cristian Pinto QB | 2 | – | – | – | 2 | 14 | – | |
| Zion Fowler-El WR | – | 4 | 2 | 50% | 2 | 8 | – | |
| Benjamin Newman QB | 1 | – | – | – | 1 | 23 | – | |
| Teree McDonald WR | – | 4 | 1 | 25% | 1 | 2 | – | |
| Karlos Grier WR | – | 1 | – | 0% | – | – | – | |
| Richard Perkins Jr. WR | – | 1 | – | 0% | – | – | – | |
| Johans Bars TE | – | 1 | – | 0% | – | – | – |