
Week 7Sat, Oct 17ESPN+Raymond James Stadium
| Q1 | Q2 | Q3 | Q4 | T | |
|---|---|---|---|---|---|
 KENT | 2 | 0 | 0 | 0 | 2 |
 USF | 0 | 10 | 7 | 12 | 29 |
Play-by-play
FinalLine of scrimmageFirst down
Last play·Q4
00:15Loss of 1 yards
N.Good rushed for -1 yards. Tackled by M.Ziglar at KENT End Zone. SAFETY.
See playsHide plays
Leaders
Passing
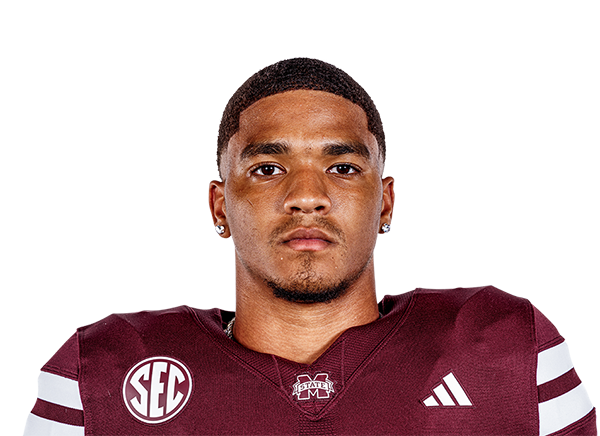

Receiving
4 REC on 10 TGT, 0 TD
56 YDS

Team stats
KENT USF228 Total yards 271
3.3 Yards per play 4.6
165 Passing yards 193
63 Rushing yards 78
15 First downs 16
69 Plays 59
6-17 3rd down 3-11
0-4 4th down 1-2
0-3 Red zone 2-3
1 Turnovers 0
8 Penalties 6
31:38 Possession 28:22
Box score
| Passing | C/ATT | YDS | AVG | TD | INT | SACK | RTG |
|---|---|---|---|---|---|---|---|
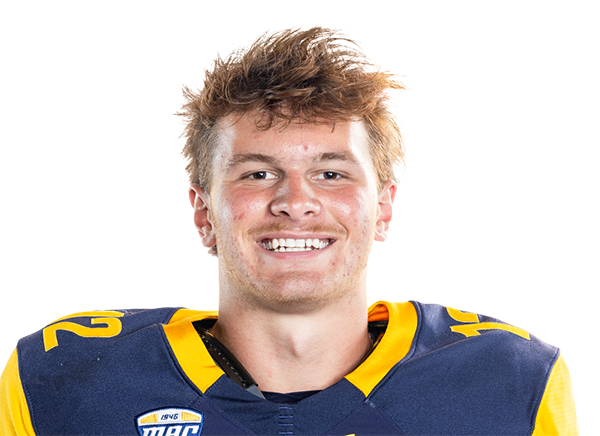 Dru DeShields QB · #12 | 17/30 | 165 | 5.5 | 0 | 0 | 2 | 102.9 |
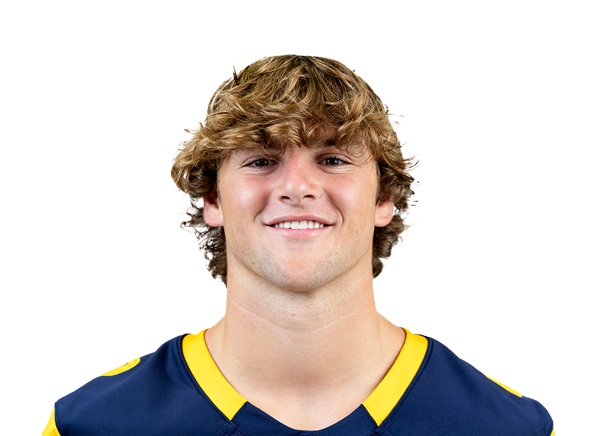 Nolan Good QB · #02 | 0/3 | 0 | 0.0 | 0 | 0 | 1 | 0.0 |
| Team | 17/33 | 165 | 5.0 | 0 | 0 | 3 |
| Rushing | CAR | YDS | AVG | TD | LONG |
|---|---|---|---|---|---|
| Brandon White RB · #22 | 10 | 37 | 3.7 | 0 | 21 |
| Nolan Good QB · #02 | 5 | 16 | 3.2 | 0 | 14 |
 Jakorion Caffey RB · #05 | 7 | 16 | 2.3 | 0 | 11 |
| Dru DeShields QB · #12 | 9 | 12 | 1.3 | 0 | 10 |
 Hunter Hopperton TE · #18 | 1 | 1 | 1.0 | 0 | 1 |
 Da'Realyst Clark WR · #08 | 1 | 0 | 0.0 | 0 | 0 |
 Donovan Delaney Jr. RB · #25 | 1 | 0 | 0.0 | 0 | 0 |
 Wayne Harris WR · #06 | 1 | -5 | -5.0 | 0 | 0 |
| Jake Stoeckel P · #97 | 1 | -14 | -14.0 | 0 | 0 |
| Team | 36 | 63 | 1.8 | 0 | 21 |
| Receiving | REC | TGT | YDS | AVG | TD | LONG |
|---|---|---|---|---|---|---|
| Brendyn Smith WR · #85 | 4 | 10 | 56 | 14.0 | 0 | 30 |
 Ardell Banks WR · #01 | 2 | 5 | 39 | 19.5 | 0 | 22 |
| Wayne Harris WR · #06 | 4 | 4 | 28 | 7.0 | 0 | 11 |
| Da'Realyst Clark WR · #08 | 2 | 5 | 20 | 10.0 | 0 | 16 |
| Hunter Hopperton TE · #18 | 2 | 3 | 14 | 7.0 | 0 | 8 |
| Brandon White RB · #22 | 2 | 3 | 5 | 2.5 | 0 | 7 |
 Tommy Arnold TE · #45 | 1 | 1 | 3 | 3.0 | 0 | 3 |
 Jared Kelley WR · #04 | 0 | 1 | 0 | 0.0 | 0 | – |
 Zy'aire Fletcher TE · #11 | 0 | 1 | 0 | 0.0 | 0 | – |
| Team | 17 | 33 | 165 | 9.7 | 0 | 30 |
| Defense | TOT | SOLO | SACK | TFL | QB HIT | PD | INT | FF |
|---|---|---|---|---|---|---|---|---|
 Hayden Dawahare LB · #10 | 3 | 2 | 1 | 1 | 1 | 0 | 0 | 0 |
 Josue Cordoba DL · #08 | 2 | 2 | 2 | 2 | 2 | 0 | 0 | 0 |
 Dion'Dre Taylor DL · #91 | 2 | 2 | 0 | 1 | 0 | 0 | 0 | 0 |
 Jaihien Roy DL | 1 | – | 1 | 1 | 1 | 0 | 0 | 0 |
 Aiden Burgess DL · #52 | 1 | 1 | 1 | 1 | 1 | 0 | 0 | 0 |
| Joel Cordoba DB · #02 | 1 | 0 | 0 | 0 | 0 | 0 | 0 | 0 |
| Trey Rubinstein LB · #32 | 1 | 1 | 0 | 0 | 0 | 0 | 0 | 0 |
 A'tiq Muhammad DB · #01 | 1 | 1 | 0 | 0 | 0 | 0 | 0 | 0 |
| Team | 12 | 9 | 5 | 6 | 5 | 0 | 0 | 0 |
| Kicking | FG | PCT | XP | PTS |
|---|---|---|---|---|
 Sean Leonard K · #96 | 0/1 | 0% | 0/0 | 0 |
| Punting | NO | YDS | AVG | IN 20 | LONG |
|---|---|---|---|---|---|
| Jake Stoeckel P · #97 | 4 | 163 | 40.8 | 0 | 45 |
Advanced team stats
Explosive 20+ rush · 25+ catch · 40+ home runKENT USF2 Explosive plays 1
2.9% Explosive rate 1.7%
1 Explosive rushes 0
1 Explosive passes 1
51 Explosive yards 36
0 Home runs 0
3 Red zone trips 4
0% Red zone TD rate 50%
0.59 Line yards per carry 1.52
40% Stuff rate 35%
3 Sacks allowed 4
6 Havoc plays 5
Advanced player stats
| KENT | Carries | Targets | Rec | Catch% | Touches | Share | Yards | TD |
|---|---|---|---|---|---|---|---|---|
| Brandon White RB | 10 | 3 | 2 | 67% | 12 | 42 | – | |
| Dru DeShields QB | 9 | – | – | – | 9 | 12 | – | |
| Jakorion Caffey RB | 7 | – | – | – | 7 | 16 | – | |
| Wayne Harris WR | 1 | 4 | 4 | 100% | 5 | 23 | – | |
| Nolan Good QB | 5 | – | – | – | 5 | 16 | – | |
| Brendyn Smith WR | – | 10 | 4 | 40% | 4 | 56 | – | |
| Da'Realyst Clark WR | 1 | 5 | 2 | 40% | 3 | 20 | – | |
| Hunter Hopperton TE | 1 | 3 | 2 | 67% | 3 | 15 | – | |
| Ardell Banks WR | – | 5 | 2 | 40% | 2 | 39 | – | |
| Tommy Arnold TE | – | 1 | 1 | 100% | 1 | 3 | – | |
| Donovan Delaney Jr. RB | 1 | – | – | – | 1 | – | – | |
| Jake Stoeckel P | 1 | – | – | – | 1 | -14 | – | |
| Jared Kelley WR | – | 1 | – | 0% | – | – | – | |
| Zy'aire Fletcher TE | – | 1 | – | 0% | – | – | – |