
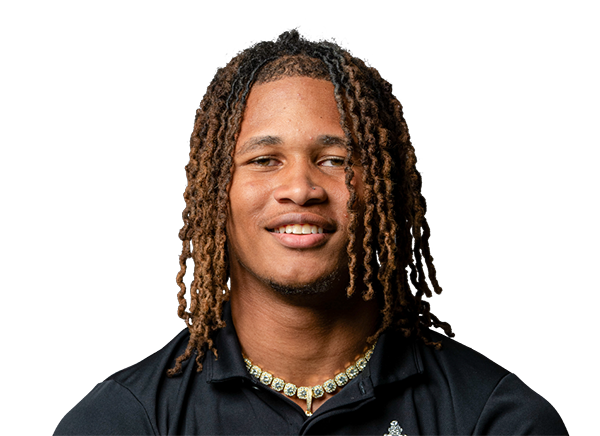
79 2026 receiving yards
4 of 7 2026 catches
0 2026 TDs
2 Explosive plays
28 Career games (12 starts)
Career
| Season | Team | GP | GS | Rec-Tgt | Yards | YPR | TD |
|---|---|---|---|---|---|---|---|
| 2026 |  UCLA | 4 | 0 | 4-7 | 79 | 19.8 | 0 |
| 2025 |  San Jose State | 12 | 12 | 43-84 | 688 | 16.0 | 3 |
| 2024 |  Purdue | 12 | 0 | 6-11 | 72 | 12.0 | 2 |
2026 Percentile vs WRs
Receiving yards per game 19.8 43
Yards per catch 19.8 92
Catch rate 57.1% 34
Receiving TDs 0 0
Around Leland
Projected 2026 starters · 2026 production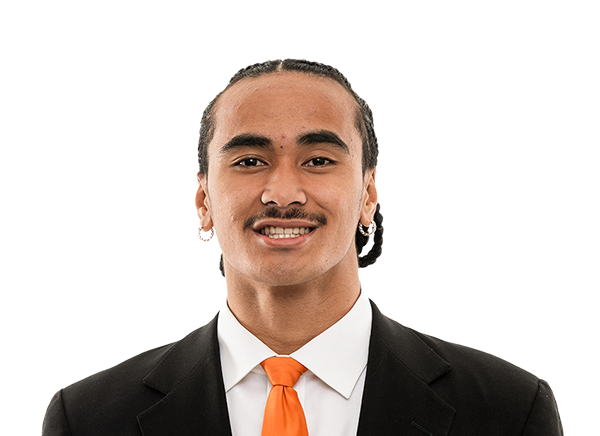


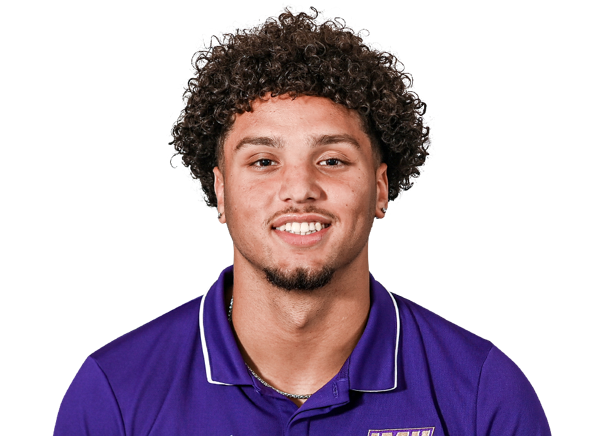


The situation
UCLA 2026 offense ›Explosive play rate 14.8% 87
Red zone TD rate 70.3% 41
Line yards per carry 3.0 86
Sack rate allowed 5.4% 56
 @ MD
 @ ORE
 WIS