

-4 2025 rush yards
0 2025 total TDs
1% Team touch share
12 Career games (1 starts)
Career
| Season | Team | GP | GS | Carries | Rush yds | YPC | Rec | Rec yds | TD |
|---|---|---|---|---|---|---|---|---|---|
| 2025 |  SMU | 12 | 1 | 2 | -4 | -2.0 | 3 | 30 | 0 |
2025 Percentile vs RBs
Rush yards per game -0.3 0
Yards per carry -2.0 0
Receiving yards per game 2.5 26
Total TDs 0 0
Around Link
Projected 2026 starters · 2025 production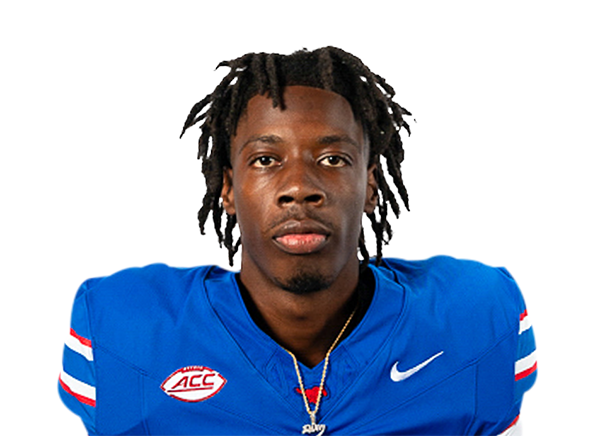
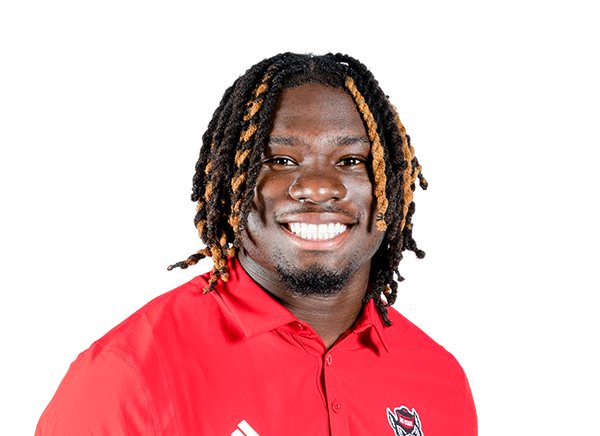

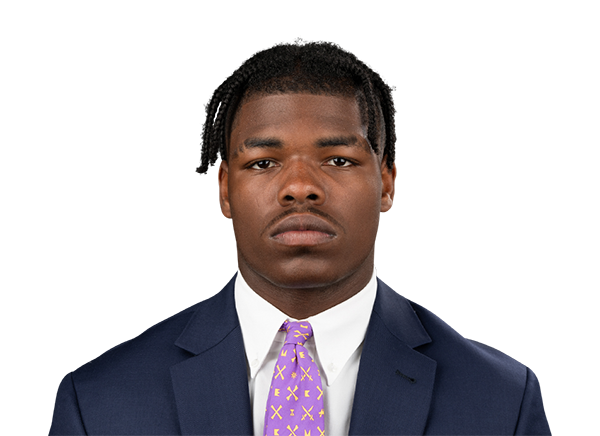

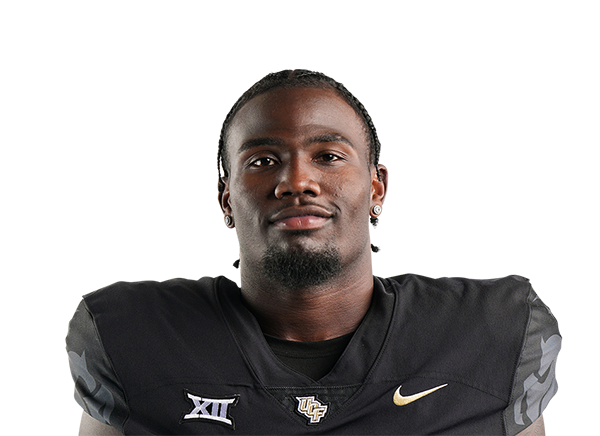
The situation
SMU 2025 offense ›Explosive play rate 11.1% 51
Red zone TD rate 81.0% 93
Line yards per carry 2.3 35
Sack rate allowed 3.8% 89
2025 Game log
| Week | Opponent | Carries | Rushing yards | Rushing TDs | Targets | Receptions | Receiving yards | Receiving TDs | RZ opps | Touch share |
|---|---|---|---|---|---|---|---|---|---|---|
| W1 | East Texas A&M Lions | 1 | -1 | — | 0 | 0 | 0 | — | 0 | |
| W2 |  BAY | 0 | 0 | — | 1 | 1 | 8 | — | 0 | |
| W3 |  @ MOSU | 0 | 0 | — | 2 | 0 | 0 | — | 0 | |
| W4 |  @ TCU | 0 | 0 | — | 1 | 1 | 12 | — | 0 | |
| W6 |  SYR | 0 | 0 | — | 1 | 0 | 0 | — | 0 | |
| W7 |  STAN | 0 | 0 | — | 1 | 1 | 10 | — | 0 | |
| W8 |  @ CLEM | 1 | -3 | — | 0 | 0 | 0 | — | 0 | |
| W14 |  @ CAL | 0 | 0 | — | 1 | 0 | 0 | — | 0 |