
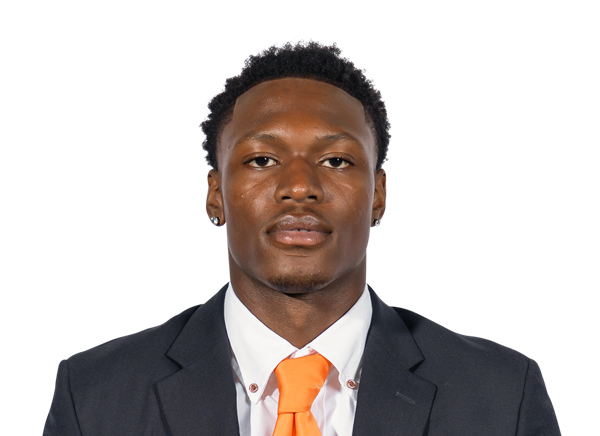
405 2026 pass yards
2-2 2026 TD-INT
112.0 Passer rating
7 Career games (1 starts)
Career
| Season | Team | GP | GS | Cmp-Att | Pass yds | TD-INT | Rtg | Rush yds |
|---|---|---|---|---|---|---|---|---|
| 2026 |  UTEP | 7 | 1 | 44-72 | 405 | 2-2 | 112.0 | 414 |
2026 Percentile vs QBs
Pass yards per game 57.9 14
Completion rate 61.1% 37
Yards per attempt 5.6 9
TD rate 2.8% 15
INT rate 2.8% 34
Passer rating 112.0 12
Around Raymond
Projected 2026 starters · 2026 production

WR-X Jeremiah Nash WR · 82 rec yds · 7g




The situation
UTEP 2026 offense ›Explosive play rate 11.6% 46
Red zone TD rate 60.9% 13
Line yards per carry 1.2 1
Sack rate allowed 20.0% 0
2026 Game log
| Week | Opponent | Completions | Pass attempts | Passing yards | Passing TDs | INTs | Carries | Rushing yards | Rushing TDs | Sacks taken |
|---|---|---|---|---|---|---|---|---|---|---|
| W1 |  @ OKLA | 3 | 5 | 26 | 0 | 0 | 9 | 49 | 0 | 2 |
| W2 | Texas Southern Tigers | — | — | — | — | — | 3 | 93 | 1 | — |
| W3 |  @ MICH | 3 | 6 | 7 | 0 | 0 | 6 | 18 | 0 | 0 |
| W4 |  ORST | 2 | 2 | 11 | 0 | 0 | 4 | 0 | 0 | 0 |
| W5 |  @ UNM | 1 | 5 | 34 | 0 | 2 | 11 | 135 | 1 | 1 |
| W6 |  NEV | 16 | 26 | 132 | 2 | 0 | 15 | 65 | 0 | 4 |
| W7 |  SJSU | 19 | 28 | 195 | 0 | 0 | 19 | 55 | 0 | 8 |