
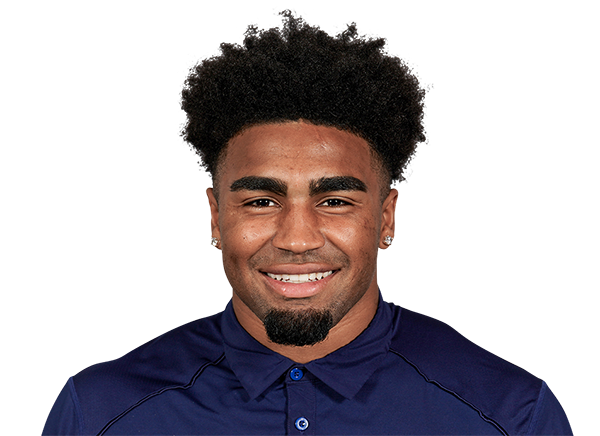
246 2026 rush yards
0 2026 total TDs
16% Team touch share
6 Explosive plays
36 Career games (13 starts)
Career
| Season | Team | GP | GS | Carries | Rush yds | YPC | Rec | Rec yds | TD |
|---|---|---|---|---|---|---|---|---|---|
| 2026 |  Duke | 6 | 1 | 51 | 246 | 4.8 | 5 | 29 | 0 |
| 2025 |  Rutgers | 3 | 0 | 22 | 119 | 5.4 | 0 | ||
| 2024 |  Florida Atlantic | 12 | 11 | 165 | 844 | 5.1 | 40 | 466 | 14 |
| 2023 |  Florida State | 9 | 1 | 7 | 117 | 16.7 | 1 | ||
| 2022 | Florida State | 6 | 0 | 18 | 64 | 3.6 | 1 | 3 | 2 |
2026 Percentile vs RBs
Rush yards per game 41.0 57
Yards per carry 4.8 46
Receiving yards per game 4.8 45
Total TDs 0 0
Around CJ
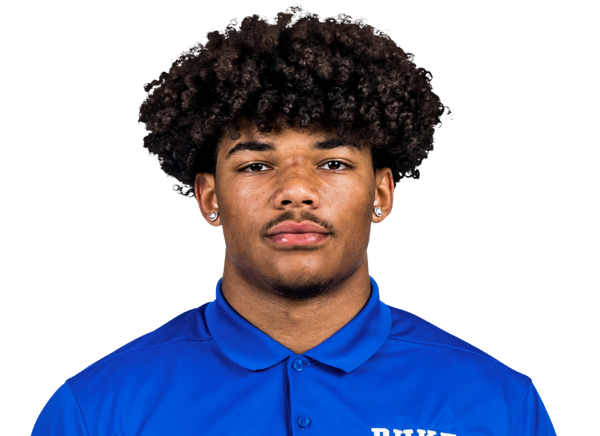
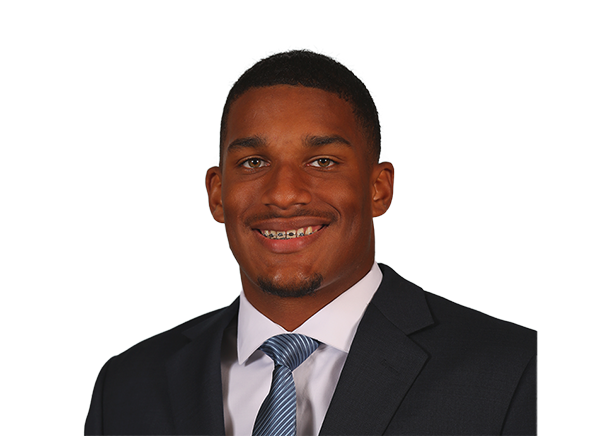
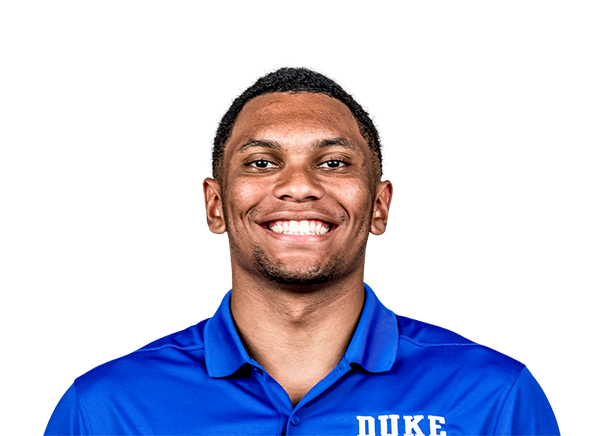
Projected 2026 starters · 2026 production

The situation
Duke 2026 offense ›Explosive play rate 14.0% 78
Red zone TD rate 67.6% 32
Line yards per carry 3.1 89
Sack rate allowed 1.3% 98
 TULN
 @ ILL
 STAN
 @ GT
 UNC